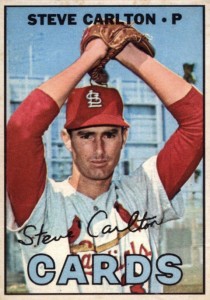
What Happened to Steve Carlton?
Steve Carlton, otherwise known as “Lefty”, will turn 74 this December. In today’s age of specialization and analytics driven pitching decisions, it seems a lifetime ago since we saw a pitcher amass 280 innings. Carlton managed to do it 5 times, eclipsing 300 innings in 1972 and 1980. 4136 strikeouts in 5217.2 innings seems unattainable by any modern pitcher whose per game innings limit falls between 4 and 6 innings per outing. Analytics has allowed for us to examine the game in a way that we can question our eyes and intuition. The science of sabrmetrics has permitted us to examine inefficiencies in the marketplace. Whether you’re an owner or GM in real life or in the fantasy realm, inefficiencies allow for us to capitalize on an unaware market. We pay less for what really matters and sell high on what we believe does not.
We’ve seen ERA scrapped for WHIP. We’ve witnessed the emergence of FIP, CERA, dERA, Def Eff, DIPS, Adjusted ERA, IR, etc … as key analytic placements that decide the effectiveness of a pitcher. It begs the question, would the Steve Carlton as we know him have existed if analytics driven decisions were as dominant in his day?
It’s amazing how we have come full circle. In examining the modern pitcher under the premise that we are searching for inefficiencies in the market place, should we not take a closer look at something as simple as innings pitched? Based on the numbers below, as real life or fantasy GM’s let’s take a look at placing a premium value on the pitchers that are extending their outings beyond the new norm of “two times around the order”.
Year 160. 180. 192. 200. 215
2018. 26. 12. 8. 5. 1
2017. 89. 66. 15. 15. 0
2016. 79. 56. 17. 15. 8
2015. 75. 46. 34. 28. 9
2014. 60. 35. 50. 34. 14
As a reminder, in examining the numbers above, they do not represent unique placeholders. For example, this past season only 3 unique pitchers threw 192-199 innings. In the upcoming week, I will balance this potential inefficiency against $ value on the market and try to ascertain the consistency of a pitcher as they move through the categories. If a pitcher throws 160 innings how certain is it that he will be able to hit the 180 mark the following season? Could innings be as simplistic as the BB was for Billy Beane? What’s the most important stat and/or analytic formula for you when assessing pitching?